We have added some new features to Zoined analytics service. Here is a list of the major additions and changes:
- The dashboard charts now have an option to open up a new multi-series chart underneath the main chart presenting a corresponding time series chart that shows by default top 5 products trend for the chosen metric and time period. The perspective can be changed to show other data as well like for example top product categories, stores or suppliers. The functionality is similar as in the metric snippets on the dashboard, but with these new time series charts it is also possible to change the time period used for both charts from the upper chart (clicking on a bar for drill-down). Drill-down is now enabled also in these new multi-series charts.
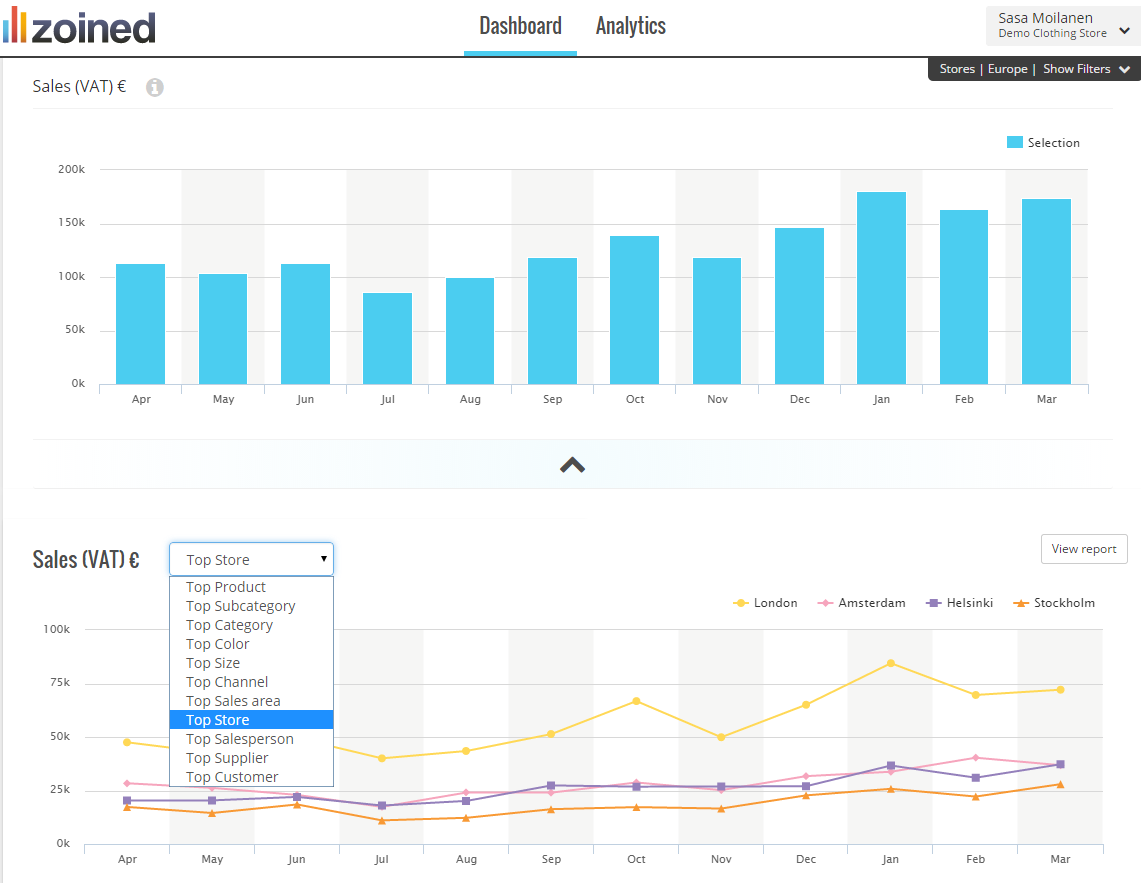
-
The filter elements such as metrics and groupings can now be rearranged by dragging and dropping (also in touchscreens). This is useful especially in data table reports when the order of the columns needs to be changed.
-
The metric comparison section in emails has been updated to have wider range of selection options available. Admin users can now decide whether to show in addition to actuals in the same chart also comparisons against: “To same time last year”, “Previous comparable period” or “Budget”.
-
Existing reports “Customer Segments” and “Store Dashboard” have been updated to have better aligned time selections and drill-down capabilities based on end user choices.