Through our Zoined Retail Analytics service we have been gathering data from our retail chain customers in the Nordic market for some time now and what is really interesting is the wide variation in the performance of the sales persons. The best sales persons in specialty retail typically sell over twice as much per working hour compared to the average sales person working in the same chain.

There are of course always a lot of explaining factors for the differences and some are difficult to measure from pure sales data alone. These are things like location and assortment of the store, visitor traffic there and also spending power in the area where the store is located. Also, some sales people have a bigger role in the back office activities and less in actual sales and some people are sitting a lot behind cash registers while some have more chance for real cross-selling and up-selling activities with the customers coming into the store.
But these are variables known to a store manager in her own store. And combining this understanding of her business and her people with the key performance metrics described below is crucial in creating an atmosphere where success is rewarded and less well performing sales persons are supported to get back on track.
Ideally data should be available for analysis from Point-of-Sales (PoS) systems, time and attendance systems and visitor counting/tracking systems. A proper data warehouse combines this kind of data easily allowing all kind of analysis from multiple perspectives.
And here are the 3 key metrics that matter:
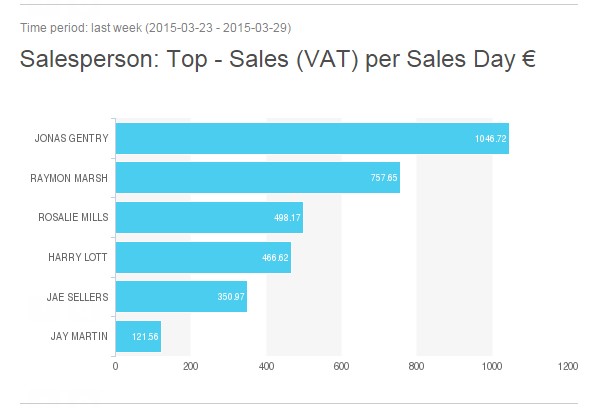
1. Sales per work hour (€)
This metric shows a comparable sales figure for each sales person based on how much sales they generate per hour on average. Can be used also on daily level as in the example below.
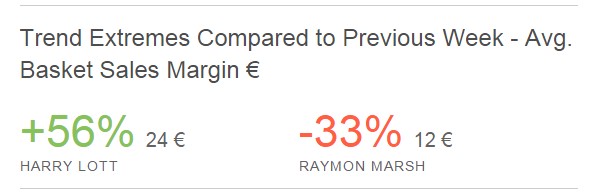
2. Average transaction margin (€)
This metric shows how well the sales person is able to do cross-selling and upselling while making sure there is focus also on non-discounted / high margin items sales. This is basically a figure for showing how much margin is generated for each receipt on average. Also called as “Average basket sales margin” as in the example below.
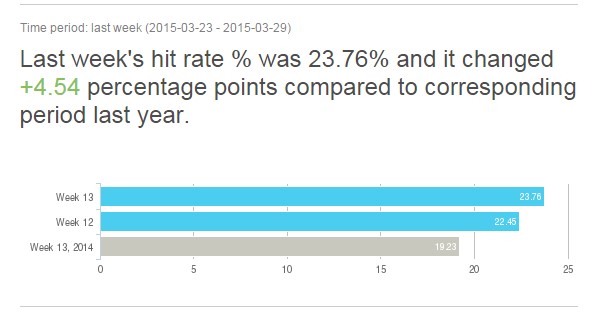
3. Hit rate (%)
This metric shows what is the percentage of visitors coming to the store that actually buy something. This figure, also referred to as “Conversion rate”, is useful in understanding whether staffing works well and whether there are problems with the service (potential customers coming in but leaving without buying because of lack of service or long queues). Having problems in assortment is also of course one reason for low hit rates but that is another story.
The delivery of this kind of information is best done via visual automated emails directly to the store manager’s inbox. An example could look something like this >
There is a lot to learn also about the patterns of the best and worst performing sales persons. Various algorithms can be used to crunch the data automatically and provide insights on what are the explaining factors behind the differences between stores and sales people. The greatest sales persons might for example be very good in cross-selling or upselling certain kind of items and those kinds of insights are only revealed via specific algorithms that find the statistically relevant insights from the huge mass of receipt data. It is then important to deliver that information to chain management and store managers automatically in an easy to understand format. The whole process from start to end can be handled easily with new next generation retail analytics SaaS services such as e.g. with Zoined Retail Analytics service.